Energy availabilities for state and local development: 1975 data volume Page: 53 of 292
Pages: 285View a full description of this report.
Extracted Text
The following text was automatically extracted from the image on this page using optical character recognition software:
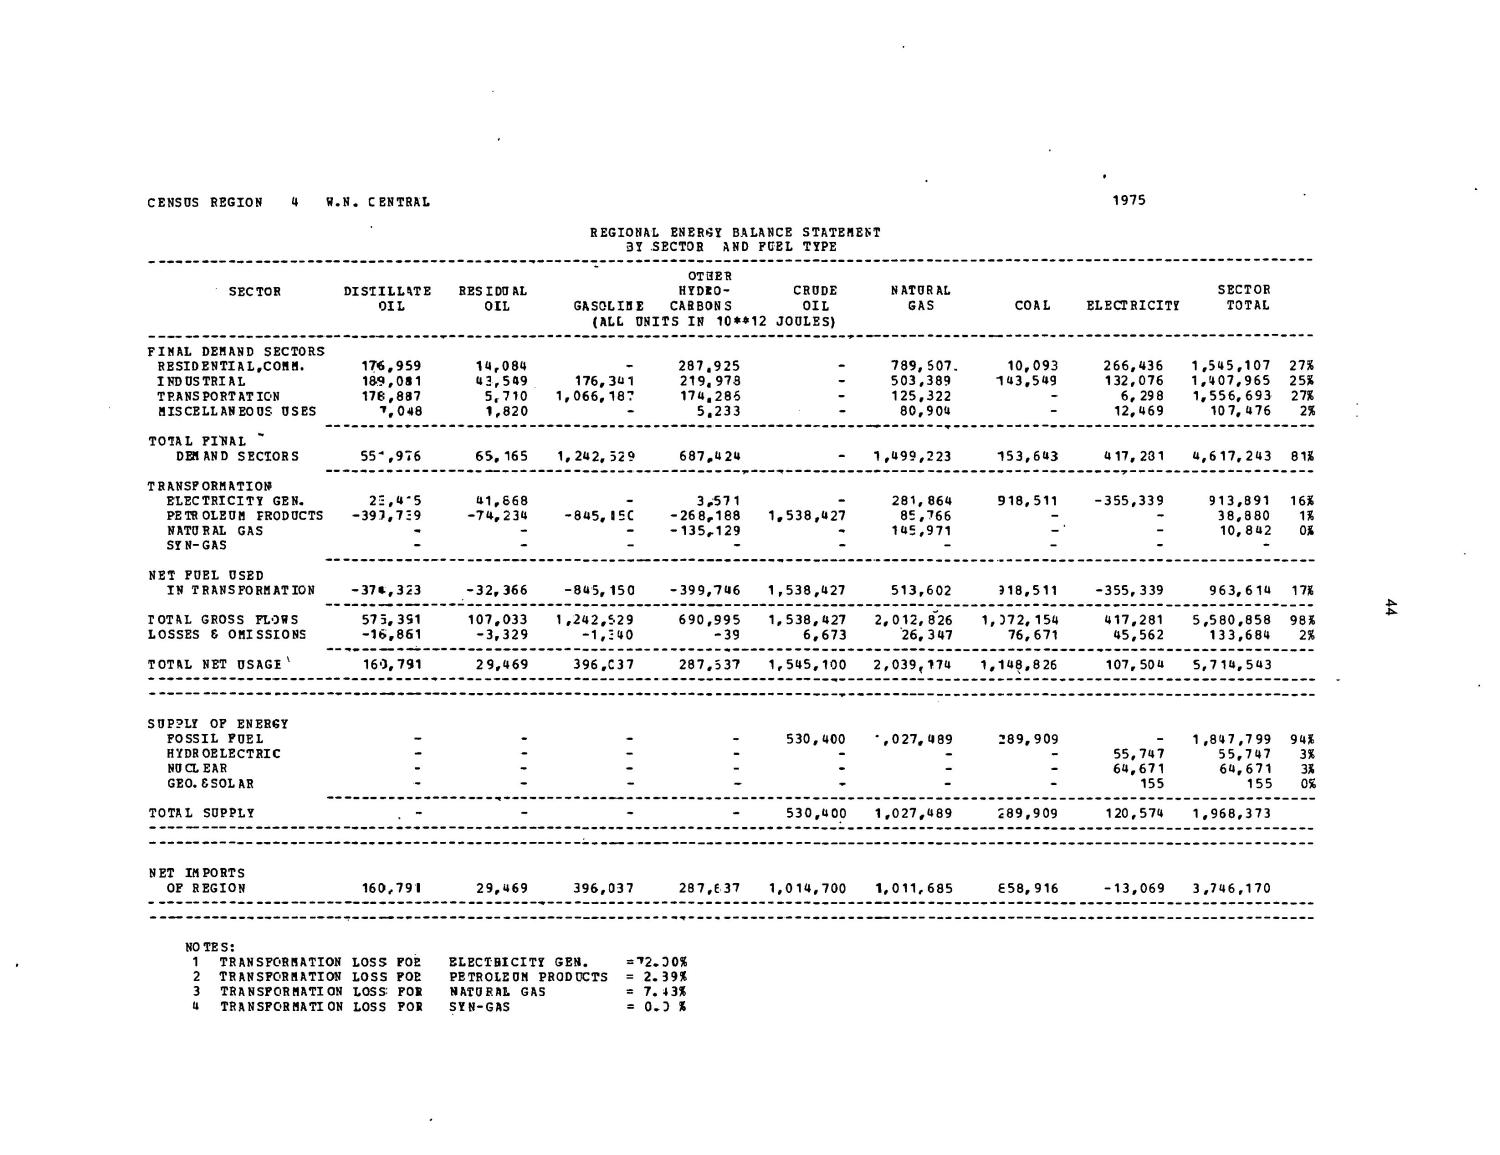
                                CENSUS EEGION 4 W.N. CENTRAL
1975
REGIONAL ENERGY BALANCE STATEMENT
3Y
SECTOR AND
FUEL TYPE
SECTOR
DISTILLATE
OIL
RESIDUAL
OIL
OTHER
HYDRO-    CRUDE
GASOLIDE    CARBONS    OIL
(ALL UNITS IN 10**12 JOULES)
NATURAL
GAS
COAL
ELECTRICITY
SECTOR
TOTAL
FINAL DEMAND SECTORS
RESIDENTIAL,COMM.
176,959
14,084
-
287,925
-
789, 507.
10,093
266,436
1 ,545,107
27*
INDUSTRIAL
189,0*1
43,549
176,34 1
219,978
-
503,389
143,549
132,076
1,407,965
25*
TP.ANS PORT AT ION
178,887
5,710
1,066, 187
174,286
-
125,322
-
6, 298
1,556,693
27*
MISCELLANEOUS USES
"*,048
1,820
•
5,233
-
80,904
12,469
107, 476
2*
TOTAL FINAL '
DEMAND SECIORS
55",976
65, 165
1,242, 529
687,424
-
1 ,499,223
153,643
417, 231
4,617,243
81*
TRANSFORMATION*
ELECTRICITY GEN.
22,4-5
41,668
3,57 1
281,864
918,511
-355,339
913,891
16*
PETROLEUM FRODUCTS
-397,729
-74,234
-845, ISC
-268,188
1,538,427
85,766
-
-
38,880
1*
NATURAL GAS
-
-
-
-135,129
**
145,971
-
10, 842
0*
SIN-GAS
-
-
-
-
-
NET FUEL USED
IN TRANSFORMATION
-374,323
-32,366
-845, 150
-399,746
1,538,427
513,602
918,511
-355, 339
963,614
17*
TOTAL GROSS FLOWS
57 5,351
107,033
1 ,242,529
690,995
1,538,427
2,012, 826
1, 372, 154
417,281
5,580,858
98*
LOSSES 6 OMISSIONS
-16,861
-3,329
-1,240
-39
6,673
26, 3 47
76,671
45,562
133,684
2*
TOTAL NET USAGE'
160,791
29,469
396 ,C 3 7
287.537
1,545,100
2,039,174
1,148,826
107,504
5,714,543
SUPPLY OF ENERGY
FOSSIL FUEL
-
-
-
-
530,400
• ,027, 489
289,909
-
1 ,847 ,799
94*
HYDROELECTRIC
-
•
-
-
-
-
-
55,747
55,747
3*
NUa EAR
-
-
-
-
-
-
-
64,671
64,671
3*
GEO. ESOL AR
-
-
-
“
-
155
155
OS
TOTAL SUPPLY
. -
-
-
-
530,400
1 ,027,489
289,909
120,574
1,968,373
NET IMPORTS
OF REGION    160,791    29,469    396,037    287,637    1,014,700    1,011,685    658, 916    -13,069    3 ,746,170
NOTES:
1
TRANSFORMATION
LOSS
FOE
ELECTRICITY GEN.
= ’’2.00*
2
TRANSFORMATION
LOSS
FOE
PETROLEUM PRODUCTS
= 2.39*
3
TRANSFORMATI ON
LOSS:
FOR
NATURAL GAS
= 7. 4 3*
4
TRANSFORMATION
LOSS
FOR
SYN-GAS
= 0.0 *
Upcoming Pages
Here’s what’s next.
 54 of 292
55 of 292
56 of 292
57 of 292
54 of 292
55 of 292
56 of 292
57 of 292
Search Inside
This report can be searched. Note: Results may vary based on the legibility of text within the document.
Tools / Downloads
Get a copy of this page or view the extracted text.
Citing and Sharing
Basic information for referencing this web page. We also provide extended guidance on usage rights, references, copying or embedding.
Reference the current page of this Report.
Mills, J. B.; Rice, P. L. & Vogt, D. P. Energy availabilities for state and local development: 1975 data volume, report, January 1, 1980; Tennessee. (https://digital.library.unt.edu/ark:/67531/metadc1089758/m1/53/: accessed July 16, 2024), University of North Texas Libraries, UNT Digital Library, https://digital.library.unt.edu; crediting UNT Libraries Government Documents Department.