Sulfur Partitioning During Vitrification of INEEL Sodium Bearing Waste: Status Report Page: 27 of 65
This report is part of the collection entitled: Office of Scientific & Technical Information Technical Reports and was provided to UNT Digital Library by the UNT Libraries Government Documents Department.
Extracted Text
The following text was automatically extracted from the image on this page using optical character recognition software:
20 100 . 350
18 90 Temp 325
0 16 80 CO2 300
14 - 70 N 275 0
N 12 60 250 '
10 - 50 /- 225 1
Ci 8 -. 40 -e-p200
x 6 30 -eNO 175
O NO / - 2
Z 4 U 20 2/ \ 150
8 2 10 125
- -_ --- -- --- . .. ... H 2
0 0 2 100
62 64 66 68 70 72 74 76
Time (min)
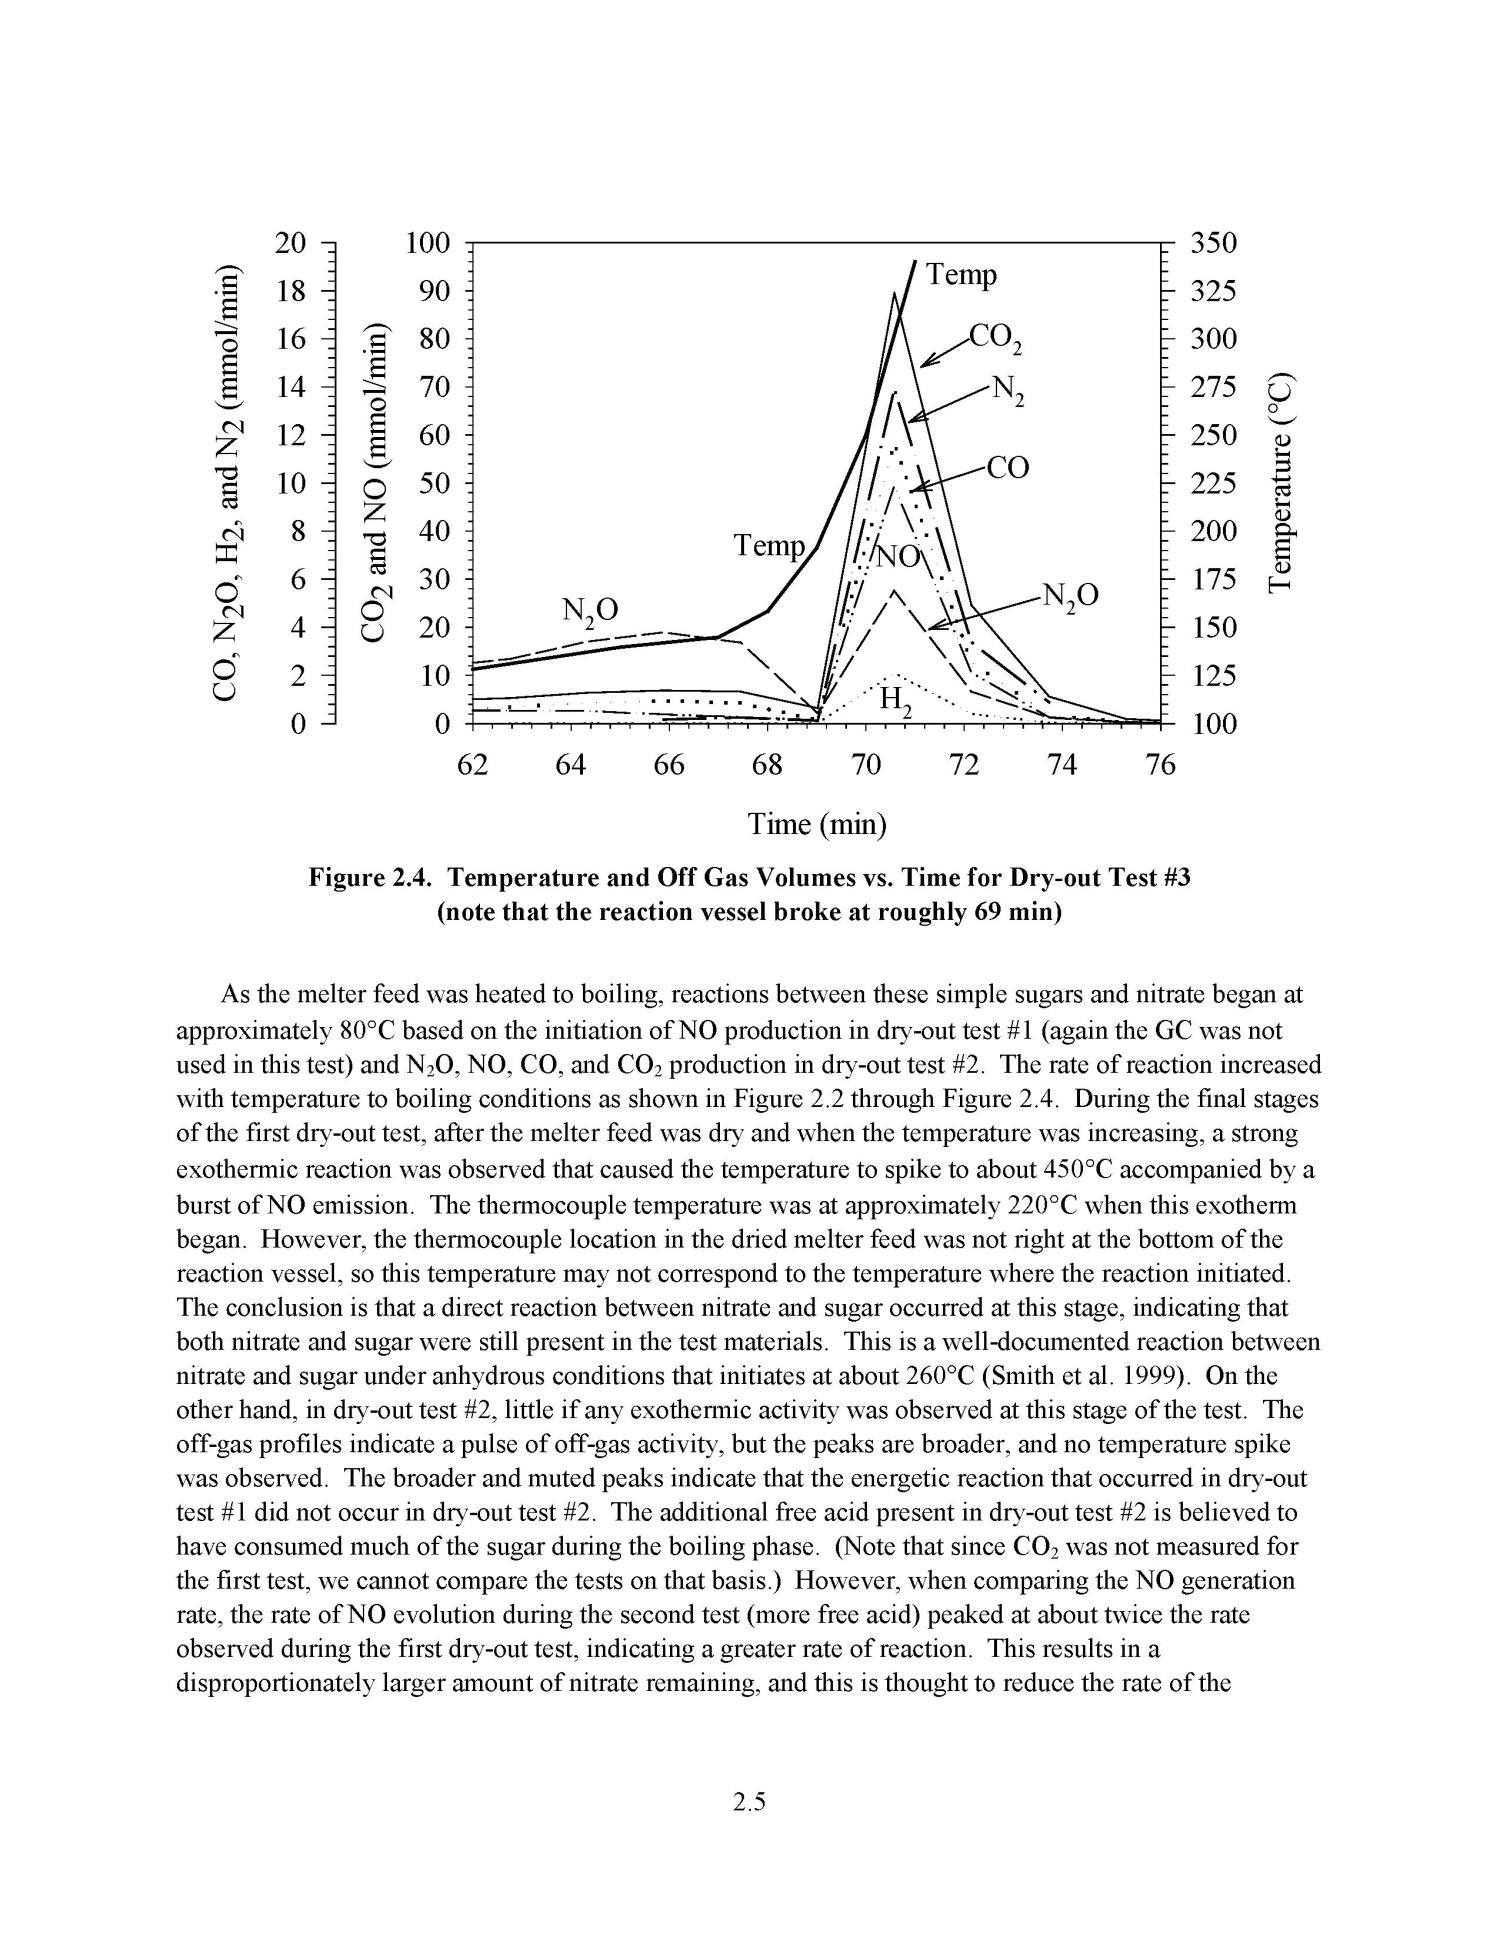
Figure 2.4. Temperature and Off Gas Volumes vs. Time for Dry-out Test #3
(note that the reaction vessel broke at roughly 69 min)
As the melter feed was heated to boiling, reactions between these simple sugars and nitrate began at
approximately 80 C based on the initiation of NO production in dry-out test #1 (again the GC was not
used in this test) and N20, NO, CO, and CO2 production in dry-out test #2. The rate of reaction increased
with temperature to boiling conditions as shown in Figure 2.2 through Figure 2.4. During the final stages
of the first dry-out test, after the melter feed was dry and when the temperature was increasing, a strong
exothermic reaction was observed that caused the temperature to spike to about 450 C accompanied by a
burst of NO emission. The thermocouple temperature was at approximately 220 C when this exotherm
began. However, the thermocouple location in the dried melter feed was not right at the bottom of the
reaction vessel, so this temperature may not correspond to the temperature where the reaction initiated.
The conclusion is that a direct reaction between nitrate and sugar occurred at this stage, indicating that
both nitrate and sugar were still present in the test materials. This is a well-documented reaction between
nitrate and sugar under anhydrous conditions that initiates at about 260 C (Smith et al. 1999). On the
other hand, in dry-out test #2, little if any exothermic activity was observed at this stage of the test. The
off-gas profiles indicate a pulse of off-gas activity, but the peaks are broader, and no temperature spike
was observed. The broader and muted peaks indicate that the energetic reaction that occurred in dry-out
test #1 did not occur in dry-out test #2. The additional free acid present in dry-out test #2 is believed to
have consumed much of the sugar during the boiling phase. (Note that since CO2 was not measured for
the first test, we cannot compare the tests on that basis.) However, when comparing the NO generation
rate, the rate of NO evolution during the second test (more free acid) peaked at about twice the rate
observed during the first dry-out test, indicating a greater rate of reaction. This results in a
disproportionately larger amount of nitrate remaining, and this is thought to reduce the rate of the
2.5
Upcoming Pages
Here’s what’s next.
 28 of 65
29 of 65
30 of 65
31 of 65
28 of 65
29 of 65
30 of 65
31 of 65
Search Inside
This report can be searched. Note: Results may vary based on the legibility of text within the document.
Tools / Downloads
Get a copy of this page or view the extracted text.
Citing and Sharing
Basic information for referencing this web page. We also provide extended guidance on usage rights, references, copying or embedding.
Reference the current page of this Report.
Darab, John G.; Macisaac, Brett D.; Russell, Renee L.; Smith, Harry D. & Vienna, John D. Sulfur Partitioning During Vitrification of INEEL Sodium Bearing Waste: Status Report, report, July 31, 2001; Richland, Washington. (https://digital.library.unt.edu/ark:/67531/metadc723302/m1/27/: accessed April 18, 2024), University of North Texas Libraries, UNT Digital Library, https://digital.library.unt.edu; crediting UNT Libraries Government Documents Department.